The happiest places to live in Britain 2025: Berwick, Evesham, York, and more

As new research reveals the 25 happiest places to live in Britain, we examine what determines a decent quality of life in 2025.
Are you happy with where you live?
If you're in Berwick-upon-Tweed, chances are you’re positively thrilled with your lot in life.
This is according to new research from The Guardian, which named the region the happiest place in Britain.
The study ranked locations based on factors such as housing costs, local amenities, broadband speed and access to medical care.
In this article, we reveal the top three happiest areas, as well as breaking the results down by region.
3 happiest places overall
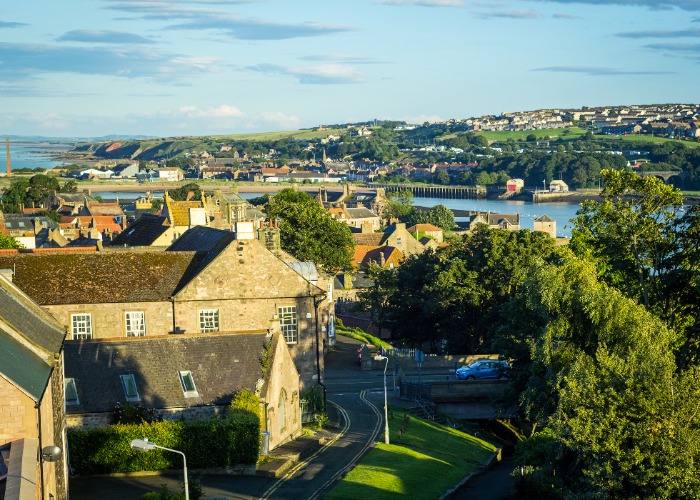
1. Berwick-upon-Tweed
Located on the border between England and Scotland, this small town is famed for its ancient walls, which you can walk in less than an hour.
The area was also LS Lowry’s favourite holiday destination and a place where he drafted more than 30 works of art.
It also hosts several arts festivals, with direct train links to Edinburgh and Newcastle in just 45 minutes.
With typical house prices of £220,000, the region is ideal for both families and retirees.
2. Evesham
Evesham sits in the heart of Worcestershire, surrounded by farmland and rivers.
The area is famous for its annual asparagus festival and local farms, which allow you to pick fruit and vegetables.
House prices start at approximately £275,000.
3. Caernarfon
Located in North Wales, Caernarfon is famous for its imposing castle and stunning scenery.
It’s also a hub for Welsh culture and language, hosting vibrant community events.
House prices range from approximately £330,000 for two-bedroom bungalows to nearly £775,000 for larger homes.
Happiest places by region
So, how do satisfaction levels stack up by region?
The North
Despite the oft-repeated claim that it's “grim up North”, there are clearly many residents who feel content with their lives.
In no particular order, these are the happiest places in The North of England.
Durham
The city is famous for its stunning cathedral and riverside walks.
Property prices are also reasonable compared to other regions, with detached houses available for under £400,000.
Likewise, good schools and strong community spirit make it attractive for families.
York
With medieval walls, cobbled streets and a famous minster, York is a hub for history lovers.
The city lies close to the North York Moors, offering nearby outdoor activities.
A typical two-bedroom terrace costs around £250,000 in the Holgate region, which is approximately a 30-minute walk from the train station.
Padiham
Situated in Lancashire, this relatively small town offers three-bedroom terraced houses from just £65,000.
The area has also recently undergone a major regeneration project, including improvements to its high street and community spaces.
Likewise, there are plenty of parks and green spaces, which makes the area ideal for families.
The South
Overall, towns and cities in the South of England bagged most spots on The Guardian’s list.
Devizes
This market town in Wiltshire is known for its medieval charm.
It also has many listed buildings, local festivals and scored strongly for community spirit.
Prices average £575,000 for listed homes, while newer builds go for around £400,000.
Lewes
Lewes lies within the South Downs National Park, allowing residents to enjoy stunning views and countryside walks.
The town also has a rich history, with a Norman castle and a Friday food market held in an 18th-century tower.
According to The Guardian, residents can choose between numerous property types – including historic cottages and eco-friendly homes, which will be available from 2027.
Newport, Isle of Wight
As the Isle of Wight’s county town, Newport blends history with modern conveniences.
It also has excellent transport links and hosts the Isle of Wight Music Festival, with this year’s headline acts including Sting and The Stereophonics.
Prices typically range from £115,000 for flats to £350,000 for detached properties.
Exeter
This cathedral city is ideally located for nature lovers, being near Dartmoor, Exmoor and the Jurassic Coast.
Additionally, it can be a great choice for commuters, with Bristol just an hour away by road and 40 minutes by train.
Property prices range from £400,000 for two-bedroom cottages to £550,000 for detached homes near the university.
Penzance
As a classic English seaside town, Penzance is just 10 miles from Land’s End and is known for its harbour and cultural attractions.
If you’re a seaside fan, you may be pleased to learn that it also has dozens of beaches, with a two-and-a-half-mile promenade.
Average prices are around £324,000, potentially inflated by second-home buyers.
Chichester
Chichester sits between the South Downs and the sea.
It is also known for its 11th-century cathedral and city walls.
Nature lovers can explore Chichester Harbour and nearby beaches.
Two-bedroom cottages typically bring in approximately £800,000.
Cirencester
Often referred to as the “Capital of the Cotswolds,” Cirencester blends Roman history with countryside charm.
According to The Guardian, its narrow, winding streets are key to its character.
Property prices average £393,469, but newer estates on the outskirts offer more affordable options.
Aylesbury
This historic market town is a popular choice with commuters, as it is possible to get to London in less than an hour.
It also lies near the Chiltern Hills, providing access to countryside walks and outdoor activities.
Terrace houses average around £350,000 and three-bed semis go for up to £600,000.
The Midlands
Again, in no particular order…
Chesterfield
Famous for its crooked church spire, Chesterfield provides residents with a mix of urban amenities and scenic countryside views.
The region is also a popular choice for ramblers, hosting an annual walking festival every May.
According to the data, house prices were approximately £202,000 in February 2025.
Shrewsbury
This town in the West of England is known for its Tudor architecture and proximity to the Shropshire hills.
It has a strong community feel and is a commuter favourite for those working in Birmingham and Manchester.
Prices for a semi-detached property are approximately £293,244.
Worcester
Worcester, in the West Midlands, is the burial place of King John and home to a striking cathedral.
Its low crime rate is another key draw.
House prices hover around £253,000, according to Rightmove.
Scotland
And what about those furthest north?
Perth
Filled with lochs and waterfalls, Perth is a cultural and natural gem.
According to The Guardian’s experts, the area also has thriving bohemian villages and foodie hubs, as well as being just a 30-minute drive from Edinburgh.
Homes in popular suburb Craigie fetch an average of £280,000, with two-bed flats netting roughly £120,000.
Haddington
The researchers argue that the town of Haddington in East Lothian balances countryside calm with easy access to both Edinburgh and the coast.
Its centre thrives with independent businesses and boutiques, with residents also having active cycling, squash and cricket communities.
Homes range from charming period properties to new builds, with four-bedroom homes typically costing a little under £650,000.
Wales
Sadly, Welsh entrants were few and far between on the list.
Aberystwyth
Sitting on the picturesque Cardigan Bay, Aberystwyth is a lively university town on the west coast of Wales.
The researchers praise its promenade, beach and spectacular sunsets, creating a vibrant culture for both surfing and golf.
Townhouses typically start at £225,000.
London and surrounding areas
And what about the capital?
The Ridgeway region of Enfield
The area surrounding Chase Farm Hospital is “a gateway to the countryside of North London”, the researchers found.
It also hosts a range of music nights and offers a strong selection of locally sourced food.
As such, it appeals to families wanting to live close to the capital but needing a quieter setting.
Property prices range from £375,000 to £570,000.
Surbiton North
This suburban area is known for its parks and riverside walks.
Trains can reach London Waterloo in just 15 minutes.
In terms of property prices, two-bedroom flats start at around £475,000.
Clapham Junction
Clapham Junction is popular for its excellent transport links, trendy cafés and even its bingo night.
If you’re after a break from the high life, green spaces such as Clapham Common can provide a break from the city buzz.
However, living here doesn’t come cheap and even a two-bedroom flat will set you back approximately £700,000.
Bounds Green
Offering good schools, cafés and cultural venues, this residential area scored highly with the judges.
According to the findings, Bounds Green is particularly popular for its ice skating and boating lake.
Semi-detached homes typically start at £1.2 million.
Bromley
Bromley is a bustling town with extensive green spaces and a lively shopping centre.
It also has excellent rail links to central London and Kent.
Properties range from £250,000 flats to large mansions costing over £1.5 million.
|
PROMOTION
|
||
|

Comments
Be the first to comment
Do you want to comment on this article? You need to be signed in for this feature