The most expensive postcodes

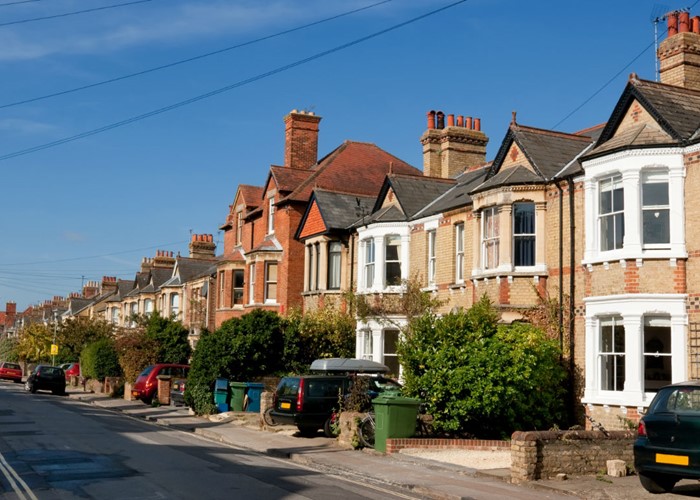
We investigate which postcodes will add pounds to your monthly bills.
A new job or family commitments are two common reasons for moving house, but your postcode can have a significant impact on your finances.
The amount people pay for things such as car insurance, broadband and energy bills can change dramatically depending on where you live.
When looking at house prices, the most expensive postcodes in the UK are unsurprisingly found in West London. Number one is SW3, in Kensington and Chelsea, where the average house price between 2007 and 2012 was £8,136,000, according to Halifax.
But even when you take house prices out of the equation there are still lots of other ways in which your postcode will directly affect your outgoings.
Here we’ve looked at a few different examples of how much your postcode could be costing you.
Car insurance
One way insurers measure how much a car insurance policy will cost is by looking at risk. If a motorist lives in an area of high crime, or where there are a lot of uninsured drivers, they will be seen as a greater risk and therefore the price of their insurance may be higher.
The list below shows postcodes across the UK which have been deemed as ‘high risk’ by insurers.
|
Post code* |
Area |
|
BD 2,9,10 |
Bradford |
|
BH 3-5, 7-9 |
Bournemouth |
|
CF 5,10-11,14,23-24,63-64 |
Cardiff |
|
CH 41-42, 44 |
Chester |
|
CR 0,4,7 |
Croydon |
|
DA 8,14-18 |
Dartford |
|
DH 5 |
Durham |
|
DN 1, 4-5, 11-12 |
Doncaster |
|
E 10-15, 17 |
East London |
|
EN 2-4 |
Enfield |
|
HX 1, 3 |
Halifax |
|
IG 3, 9-10 |
Ilford |
|
LS 1-13, 15-16, 19, 26-27 |
Leeds |
|
M 25-29, 32, 34-35, 38, 43, 45-46 |
Manchester |
|
N 2, 4-6, 8, 10-11, 13, 15-17, 19, 22 |
North London |
|
NE 2-3, 7, 12, 27-29, 32-33, 36-37, 39 |
Newcastle |
|
NW 3, 10 |
North West London |
|
OL 1-5, 7-9, 15 |
Oldham |
|
RM 1, 6, 9-10, 12 |
Romford |
|
S 4, 9, 11, 13-14, 60-61 |
Sheffield |
|
SE 1-2, 4-8, 10-11, 13-19, 21-28 |
South East London |
|
SK 1, 4, 14-16 |
Stockport |
|
SM 4, 6 |
Sutton |
|
SW 1, 3-7, 10, 12-20 |
South West London |
|
TS 3-4, 6, 10, 20 |
Cleveland |
|
TW 1, 9, 11 |
Twickenham |
|
UB 5, 7-8 |
Southall |
|
W 1-2, 5-6, 8-9, 12, 14 |
West London |
|
WA 13 |
Warrington |
|
WC 1-2, 99 |
London |
|
WF 3, 11 |
Wakefield |
|
WN 1-4, 7 |
Wigan |
Source: carinsuranceexplained.com
The Motor Insurers’ Bureau also publishes data of the areas with the highest number of uninsured drivers. In the top 20 list, 12 locations are found in the West Midlands, five are in Yorkshire and The Humber, while two are in the North West and one is in London.
Even if you live in one of these high risk areas there are other ways to cut the cost of your car insurance. Our article 25 ways to cut your car insurance is a good place to start.
Life insurance and pensions
When you buy life insurance or an annuity, the insurer will look at several different factors and then predict the number of years you’ll be alive for.
One of these is life expectancy and the longer you live, the cheaper the life insurance policy will be. Therefore if you’re living in an area with a high life expectancy, you will be paying a cheaper rate. But you'll then be expected to pay more for an annuity.
The two tables below show the areas of the UK with the highest and lowest life expectancies at age 65.
Those living in Bootle, Merseyside, have the lowest life expectancy of 84.4 for men and 89 for women and therefore would be paying a lot more for life insurance than those in Hinton St George, Somerset, where the average age is 88.7 for men and 91.6 for women.
Top 10 areas with the lowest life expectancy rate
|
Rank* |
Town |
Male |
Female |
|
1 |
Bootle, Merseyside |
84.9 |
89 |
|
2 |
Castlederg, County Tyrone |
85.0 |
89.1 |
|
3 |
Strabane, County Tyrone |
85.1 |
89.1 |
|
4 |
Belfast |
85.3 |
89 |
|
5 |
Saltcoats, Ayrshire |
85.4 |
89 |
|
6 |
Londonderry |
85.3 |
89.1 |
|
7 |
Prestonpans, East Lothian |
85.3 |
89.2 |
|
8 |
Port Glasgow, Invercylde |
85.4 |
89.2 |
|
9 |
Kilbirnie, Ayrshire |
85.4 |
89.2 |
|
10 |
Alloa, Clackmannanshire |
85.4 |
89.2 |
Top 10 areas with the highest life expectancy rate
|
Rank |
Town |
Male |
Female |
|
1 |
Hinton St George, Somerset |
88.7 |
91.6 |
|
2 |
Aldeburgh, Suffolk |
88.7 |
91.6 |
|
3 |
Frinton-on-sea, Essex |
88.5 |
91.8 |
|
4 |
Seaview, Isle of Wight |
88.5 |
91.5 |
|
5 |
Ferndown, Dorset |
88.4 |
91.5 |
|
6 |
Lyme Regis, Dorset |
88.4 |
91.5 |
|
7 |
Salcombe, Devon |
88.4 |
91.4 |
|
8 |
Broadstone, Dorset |
88.5 |
91.3 |
|
9 |
Budleigh Salterton, Devon |
88.4 |
91.3 |
|
10 |
Bembridge, Isle of Wight |
88.4 |
91.4 |
*source: Towers Watson
These variations could impact on your life insurance and annuity rates greatly. You can find out more about life insurance by reading Seven steps to cheap life insurance or get a quote by using our life insurance calculator.
Broadband bills
The price we pay for broadband internet varies quite a bit across the country. Around three million households pay out an extra £170million every year because of their postcodes, research from broadbandchoices.co.uk shows.
This is because many people don’t have access to cheaper broadband deals as their postcodes are excluded.
Surprisingly the pricing doesn’t seem to have much logic as even people living close by could have very different broadband bills. Those living in Bartons Place in Newmarket, Suffolk, for example, face bills 200% more than other houses around 50 yards away. And they’re getting speeds just a third of what their neighbours can access.
The data doesn’t stretch out to postcode level but instead shows by county the most expensive areas for broadband bills.
The most expensive areas for broadband
|
Rank |
County |
|
1 |
Herefordshire |
|
2 |
Rutland |
|
3 |
Cumbria |
|
4 |
East Riding of Yorkshire |
|
5 |
Devon |
|
6 |
Shropshire |
|
7 |
Somerset |
|
8 |
North Yorkshire |
|
9 |
Norfolk |
|
10 |
Northumberland |
Energy bills
The amount we pay for gas and electricity has risen dramatically in the past few years but there is still quite a difference when looking across the UK. Those living in Merseyside and North Wales, for example, pay the highest average bills of £1,425 whereas if you live in the East Midlands you'll be looking at a bill around the £1,373 mark.
There are lots of ways to cut your energy bills such as switching to another company which can save an average of £300. Our article Ten ways to save on energy is also stacked full of helpful tips.
|
Rank* |
Region |
Typical annual gas & electricity bill |
|
1 |
Merseyside & N Wales |
£1,425 |
|
2 |
SW England |
£1,420 |
|
3 |
W Midlands |
£1,420 |
|
4 |
SE England |
£1,403 |
|
5 |
Southern England |
£1,402 |
|
6 |
Central & S Wales |
£1,402 |
|
7 |
NE England |
£1,400 |
|
8 |
N Scotland |
£1,399 |
|
12 |
NW England |
£1,398 |
|
9 |
Central & S Scotland |
£1,395 |
|
13 |
Eastern England |
£1,394 |
|
10 |
London |
£1,388 |
|
11 |
Yorkshire |
£1,387 |
|
14 |
East Midlands |
£1,373 |
*source: Energyhelpline.com
Is it right that certain postcodes cost more to live in than others? Are these appropriate generalisations for lenders and insurers to be making about prospective customers? Let us know your thoughts in the comment box below.
More from lovemoney:
The UK's worst broadband provider
What's happening to house prices?
The most common home insurance claims
Cheap and free things to do with the kids in the summer holidays
How to rent out your home
The cost of not switching broadband
Comments
Be the first to comment
Do you want to comment on this article? You need to be signed in for this feature