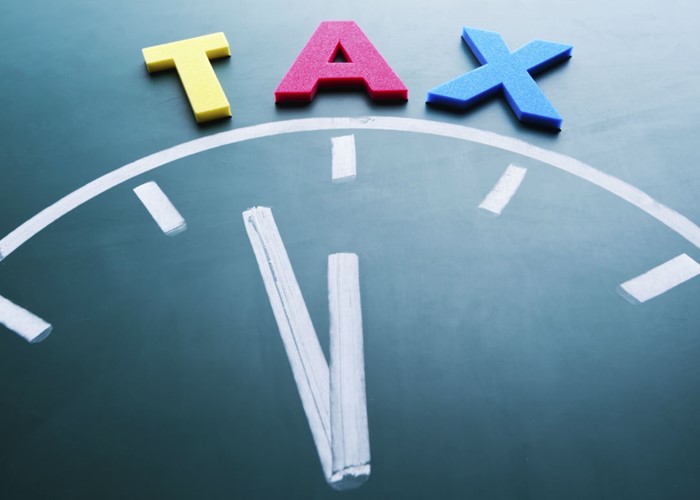
The poorest pay the most tax

The poorest people in the country pay a higher percentage of their incomes in taxes than the richest.
The poorest fifth of households pay 35.5% of their total income and benefits in direct taxes (e.g. income tax) and indirect taxes (e.g. VAT), a new report from the Office for National Statistics (ONS) has revealed. By comparison, the richest fifth of households pay out just 33.7%.
Furthermore, indirect taxes such as VAT consume 28.1% of the poorest's income after direct taxes, which compares to just 12.3% for the richest fifth.
In percentage terms, then, the poor pay a higher proportion of their income in taxes than the rich.
Inequality is reduced by taxes and benefits
But if we forget percentages and look at pounds, the rich stump up rather more cash. If you are in a poorer household earning £10,000 per year and paying 33.5% in taxes, that is £3,550. If you are in a richer household paying 33.7% in taxes on,say, £100,000, that is almost ten times as much tax at £33,700.
Related how-to guide

Cut your tax bill by thousands
Tax may be an inevitable fact of life, but there’s no reason to pay more than you have to!
See the guideBefore adding benefits or deducting taxes, the richest take in 16 times more than the poorest. For every pound the poorest get in private income, the rich get £16. If we add benefits and deduct tax, with the rich paying more in pounds, if not in percentages, they earn just £7 for every £1 earned by the poorest.
It gets better for the poorest households: if we add in benefits in kind, such as NHS services, poorer households benefit more than richer ones. This reduces the inequality between the richest fifth and the poorest fifth to £4 for every £1 that the poor either gets in cash or in services, according to ONS.
The retired benefit most from taxation
“Benefits in kind” are the value of services paid for by taxes, such as the NHS. It is largely thanks to this that the poorest retired people apparently suffer less inequality than the poorest non-retired.
The poorest fifth of retired households average a mere £2,000 in income before benefits. That £2,000 likely represents their meagre private pensions. However add in benefits such as the state pension, and benefits in kind, and deduct direct and indirect taxes, and they average a final intake of nearly £12,000, or six times their private incomes.
Related blog post
- Saran Allott-Davey writes:
A clever way to escape inheritance tax
Saran Allott-Davey of Heron House Financial Management explains how to protect more of your money from inheritance tax.
Read this post
Pensioners in the richest fifth of households average a final income of a little more than £31,000. This means the richest fifth of retired households have a final income of around £2.60 per £1 that the poorest fifth gets.
Non-retired suffer more inequality
Taxation and benefits also help redistribute wealth to the non-retired poorer households, but not as effectively.
The poorest, non-retired households average less than £7,000 in private income per year and the wealthiest average more than £87,000, a gap of £13 per £1. After adding on benefits and benefits in kind, and deducting taxes, the poor have £17,000 and the rich £64,000. The overall gap, then, is about £4 to the richest non-retired households per £1 that the poorest get.
With the poorest paying a higher percent in taxes than the richest, it is clear that our our system is not completely progressive. However, the wealthy are passing significant amounts of money to poorer people through taxation, with the poorest non-retired seeing their private incomes of a mere £7,000 (average) being boosted to around £17,000 after deducting taxes, when we add benefits and benefits in kind.
We should remember that benefits in kind are measured by the cost to the government, but due to inefficiencies, the real value of those benefits might be far smaller than the ONS figures suggests. (We don't complain about “bureaucracy” for nothing.)
Inequality summary
|
Type of household |
Final income* poorest fifth |
Final income richest fifth |
How many pounds extra the richest fifth has per pound the poorest has |
|
All households |
£15,125 |
£58,070 |
£3.84 |
|
Retired households |
£11,874 |
£31,351 |
£2.64 |
|
Non-retired households |
£17,213 |
£63,906 |
£3.71 |
*Final income includes earnings, income, benefits, minus direct and indirect taxes, plus the value of benefits in kind.
A step backwards?
The ONS report, released just days ago, was for the year ending April 2010. The report shows that inequality increased a lot in the late eighties, though it has not really changed much since.
But now, with a huge reduction in housing benefit and a firmer grip on other benefits being implemented as part of the government's austerity measures, expect that the report next year will show another increase inequality.
More: Earn tax-free interest with a cash ISA (which is simply a tax-free savings account) | Save your family thousands in taxes | Get a loan by applying tactically
Comments
Be the first to comment
Do you want to comment on this article? You need to be signed in for this feature