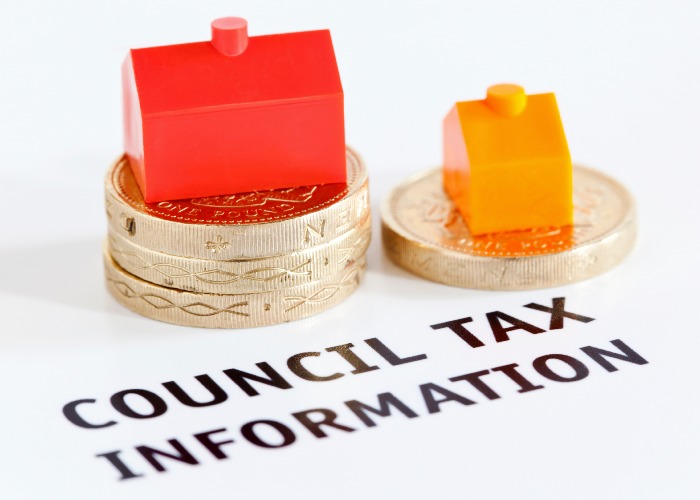
Where Council Tax is rising and falling in 2015/16

We take a look at which councils are increasing, freezing or cutting Council Tax for 2015/16.
The new tax year is nearly upon us and that means a myriad of changes that will impact our finances.
These include adjustments to Council Tax charges (or rates if you're in Northern Ireland).
So we’ve taken a look at what councils across the UK have got planned for 2015/16 and whether you’ll be paying more, less or the same.
Council Tax in England
The Government has set aside £550 million to help councils in England cope with freezing Council Tax in 2014/15 as well as in 2015/16.
Not every council has taken up the offer though, which is why the average Band D Council Tax level for the coming tax year has increased by 1.1%. In cash terms that means the average bill for 2015/16 is now £1,484, £16 more than the current tax year.
In total 241 out of 421 authorities have opted to freeze Council Tax over 2015/16 and will receive a grant from the Government. That's 10 fewer than 2014/15.
However, when you look at each individual council’s actions, the number actually freezing Council Tax in cash terms are minimal. The vast majority are imposing increases.
So where in England is Council Tax going up, staying the same or going down?
How much are you worth? Get a digital snapshot with Plans
English councils that have frozen or cut Council Tax
Here are the councils in England that have announced a cut or freeze on Council Tax for 2015/16.
|
Local authority |
Band D 2014/15 |
Band D 2015/16 |
% change |
|
Windsor & Maidenhead |
£1,166 |
£1,150 |
-1.39% |
|
Hammersmith & Fulham |
£1,034 |
£1,023 |
-1.10% |
|
Westminster |
£678 |
£674 |
-0.59% |
|
Wandsworth |
£687 |
£683 |
-0.58% |
|
Redcar & Cleveland |
£1,677 |
£1,668 |
-0.53% |
|
Kensington & Chelsea |
£1,082 |
£1,078 |
-0.37% |
|
Tower Hamlets |
£1,185 |
£1,181 |
-0.34% |
|
Southwark |
£1,211 |
£1,207 |
-0.33% |
|
Newham |
£1,245 |
£1,241 |
-0.32% |
|
Greenwich |
£1,280 |
£1,276 |
-0.31% |
|
Hackney |
£1,297 |
£1,293 |
-0.31% |
|
Cotswold |
£1,491 |
£1,486 |
-0.30% |
|
Brent |
£1,358 |
£1,354 |
-0.29% |
|
Ealing |
£1,359 |
£1,355 |
-0.29% |
|
Lewisham |
£1,359 |
£1,355 |
-0.29% |
|
Merton |
£1,406 |
£1,401 |
-0.29% |
|
Hounslow |
£1,379 |
£1,375 |
-0.29% |
|
Redbridge |
£1,395 |
£1,391 |
-0.29% |
|
Enfield |
£1,399 |
£1,395 |
-0.29% |
|
Barnet |
£1,401 |
£1,397 |
-0.29% |
|
Hillingdon |
£1,412 |
£1,408 |
-0.28% |
|
Waltham Forest |
£1,451 |
£1,447 |
-0.28% |
|
Croydon |
£1,470 |
£1,466 |
-0.27% |
|
Haringey |
£1,483 |
£1,479 |
-0.27% |
|
Richmond-upon-Thames |
£1,586 |
£1,582 |
-0.25% |
|
Kingston-upon-Thames |
£1,679 |
£1,675 |
-0.24% |
|
Uttlesford |
£1,514 |
£1,513 |
-0.04% |
|
Bournemouth |
£1,499 |
£1,499 |
0% |
|
Wigan |
£1,403 |
£1,403 |
0% |
|
Bury |
£1,514 |
£1,514 |
0% |
|
Manchester |
£1,382 |
£1,382 |
0% |
|
Rochdale |
£1,540 |
£1,540 |
0% |
|
Salford |
£1,536 |
£1,536 |
0% |
|
Stockport |
£1,607 |
£1,607 |
0% |
|
Essex |
£1,087 |
£1,087 |
0% |
|
Gloucestershire |
£1,091 |
£1,091 |
0% |
|
Hampshire |
£1,038 |
£1,038 |
0% |
|
Norfolk |
£1,145 |
£1,145 |
0% |
|
Somerset |
£1,027 |
£1,027 |
0% |
|
Suffolk |
£1,127 |
£1,127 |
0% |
|
West Sussex |
£1,162 |
£1,162 |
0% |
|
Bolton |
£1,492 |
£1,492 |
0% |
|
Oldham |
£1,607 |
£1,607 |
0% |
|
Trafford |
£1,316 |
£1,316 |
0% |
Source: Department for Communities and Local Government
How much are you worth? Get a digital snapshot with Plans
English councils that have raised Council Tax
There are simply too many councils raising Council Tax in cash terms to cover here. So instead I’ve just featured the councils imposing rises of at least 1.96%.
|
Local authority |
Band D 2014/15 |
Band D 2015/16 |
% change |
|
Luton |
£1,469 |
£1,514 |
3.06% |
|
Copeland |
£1,582 |
£1,630 |
3.05% |
|
Cornwall |
£1,512 |
£1,550 |
2.46% |
|
Eden |
£1,576 |
£1,614 |
2.38% |
|
Isle of Wight Council |
£1,513 |
£1,547 |
2.28% |
|
Tunbridge Wells |
£1,480 |
£1,513 |
2.19% |
|
West Devon |
£1,643 |
£1,678 |
2.12% |
|
Blaby |
£1,516 |
£1,548 |
2.10% |
|
Allerdale |
£1,580 |
£1,613 |
2.06% |
|
Northumberland |
£1,559 |
£1,591 |
2.06% |
|
Durham |
£1,641 |
£1,675 |
2.05% |
|
Maidstone |
£1,536 |
£1,568 |
2.05% |
|
Guildford |
£1,581 |
£1,613 |
2.04% |
|
Herefordshire |
£1,552 |
£1,584 |
2.04% |
|
Burnley |
£1,597 |
£1,630 |
2.03% |
|
Daventry |
£1,446 |
£1,475 |
2.01% |
|
Wealden |
£1,664 |
£1,698 |
2.01% |
|
Preston |
£1,612 |
£1,644 |
2.00% |
|
Leeds |
£1,349 |
£1,375 |
2.00% |
|
Warrington |
£1,427 |
£1,456 |
2.00% |
|
Lancaster |
£1,541 |
£1,571 |
2.00% |
|
Kent |
£1,069 |
£1,090 |
2.00% |
|
Oxford |
£1,208 |
£1,679 |
1.99% |
|
Surrey |
£1,196 |
£1,220 |
1.99% |
|
Dorset |
£1,192 |
£1,215 |
1.99% |
|
St Helens |
£1,422 |
£1,451 |
1.99% |
|
Devon |
£1,139 |
£1,161 |
1.99% |
|
Exeter |
£1,514 |
£1,544 |
1.99% |
|
Epsom & Ewell |
£1,581 |
£1,613 |
1.99% |
|
East Devon |
£1,542 |
£1,573 |
1.99% |
|
Isles of Scilly |
£1,217 |
£1,241 |
1.99% |
|
Plymouth |
£1,538 |
£1,568 |
1.99% |
|
Leicester |
£1,512 |
£1,542 |
1.99% |
|
Nottinghamshire |
£1,217 |
£1,241 |
1.99% |
|
Oxfordshire |
£1,208 |
£1,232 |
1.99% |
|
Buckinghamshire |
£1,094 |
£1,116 |
1.99% |
|
North Yorkshire |
£1,079 |
£1,100 |
1.99% |
|
Walsall |
£1,569 |
£1,600 |
1.99% |
|
Cumbria |
£1,162 |
£1,185 |
1.99% |
|
Wolverhampton |
£1,501 |
£1,531 |
1.99% |
|
Leicestershire |
£1,063 |
£1,084 |
1.99% |
|
Lancashire |
£1,108 |
£1,130 |
1.99% |
|
Hertfordshire |
£1,119 |
£1,141 |
1.99% |
|
Cambridgeshire |
£1,122 |
£1,144 |
1.99% |
|
Derby |
£1,099 |
£1,432 |
1.99% |
|
Mole Valley |
£1,569 |
£1,601 |
1.99% |
|
Reigate & Banstead |
£1,615 |
£1,647 |
1.99% |
|
Runnymede |
£1,549 |
£1,580 |
1.99% |
|
Spelthorne |
£1,586 |
£1,618 |
1.99% |
|
Surrey Heath |
£1,619 |
£1,651 |
1.99% |
|
Birmingham |
£1,294 |
£1,320 |
1.99% |
|
Liverpool |
£1,584 |
£1,616 |
1.99% |
|
Brighton & Hove |
£1,538 |
£1,569 |
1.99% |
|
Medway |
£1,382 |
£1,410 |
1.99% |
|
Tonbridge & Malling |
£1,509 |
£1,539 |
1.99% |
|
Gravesham |
£1,468 |
£1,497 |
1.99% |
|
Canterbury |
£1,480 |
£1,509 |
1.98% |
|
North Kesteven |
£1,473 |
£1,502 |
1.98% |
|
Darlington |
£1,494 |
£1,524 |
1.98% |
|
Woking |
£1,620 |
£1,652 |
1.98% |
|
Derbyshire |
£1,099 |
£1,120 |
1.98% |
|
East Lindsey |
£1,415 |
£1,443 |
1.98% |
|
Rotherham |
£1,497 |
£1,526 |
1.98% |
|
Sefton |
£1,530 |
£1,560 |
1.98% |
|
Wychavon |
£1,468 |
£1,497 |
1.97% |
|
Kirklees |
£1,443 |
£1,471 |
1.97% |
|
Doncaster |
£1,358 |
£1,384 |
1.97% |
|
Pendle |
£1,593 |
£1,624 |
1.96% |
|
Sheffield |
£1,497 |
£1,526 |
1.96% |
|
Mid Devon |
£1,602 |
£1,633 |
1.96% |
|
Bristol |
£1,629 |
£1,660 |
1.96% |
Source: Department for Communities and Local Government
So, some far more significant changes when it comes to Council Tax increases, with residents in Luton and Copeland needing to shell out nearly £50 extra next year.
Council Tax in Wales
Across the Welsh principality, Council Tax will rise by an average of 4.06% for 2015/16, taking the average Band D bill from £1,276 to £1,328, an increase of £52.
Here’s the breakdown of the changes in each of the Unitary Authorities.
|
Local authority |
Band D 2014/15 |
Band D 2015/16 |
% change |
|
Cardiff |
£1,166 |
£1,224 |
5.01% |
|
Monmouthshire |
£1,285 |
£1,349 |
4.98% |
|
Bridgend |
£1,413 |
£1,483 |
4.93% |
|
Swansea |
£1,280 |
£1,342 |
4.82% |
|
Newport |
£1,101 |
£1,154 |
4.81% |
|
Conwy |
£1,229 |
£1,286 |
4.68% |
|
Merthyr Tydfil |
£1,486 |
£1,554 |
4.56% |
|
Torfaen |
£1,294 |
£1,352 |
4.54% |
|
Isle of Anglesey |
£1,242 |
£1,296 |
4.33% |
|
Gwynedd |
£1,371 |
£1,430 |
4.33% |
|
Neath Port Talbot |
£1,542 |
£1,609 |
4.31% |
|
Vale of Glamorgan |
£1,261 |
£1,312 |
4.05% |
|
Rhondda Cynon Taf |
£1,461 |
£1,519 |
3.94% |
|
Caerphilly |
£1,169 |
£1,215 |
3.89% |
|
Flintshire |
£1,255 |
£1,301 |
3.68% |
|
Ceredigion |
£1,259 |
£1,300 |
3.26% |
|
Carmarthenshire |
£1,307 |
£1,348 |
3.11% |
|
Wrexham |
£1,238 |
£1,276 |
3.10% |
|
Denbighshire |
£1,380 |
£1,422 |
3.09% |
|
Blaenau Gwent |
£1,591 |
£1,635 |
2.74% |
|
Powys |
£1,255 |
£1,287 |
2.56% |
|
Pembrokeshire |
£1,005 |
£1,029 |
2.41% |
Source: StatsWales
Council Tax in Scotland
For the eighth straight year Council Tax has been frozen by all of Scotland’s 32 local authorities.
How much are you worth? Get a digital snapshot with Plans
Rates in Northern Ireland
Northern Ireland doesn’t have Council Tax, instead it uses a system called rates.
These consist of both regional and district rates and vary depending on whether the property is domestic or non-domestic.
Regional rates are set by the Northern Ireland Executive and account for just over half of a typical rates bill while district rates are fixed by each district council.
Your domestic rate is calculated as follows: domestic regional rate plus domestic district rate multiplied by the capital value of your property.
Domestic regional rates are increasing by 1.4% in 2015/16, rising from 0.3986p to 0.4042p.
The table below details the new domestic district rates. As local councils in Northern Ireland are being streamlined from 26 to 11 from 1st April 2015, the table reflects the changes to show how residents will be impacted.
|
District council before April 1st 2015 |
2014/15 rate (pence) |
District council from April 1st 2015 |
2015/16 rate (pence) |
% change |
|
Fermanagh |
0.2543 |
Fermanagh and Omagh |
0.3238 |
27.33% |
|
Castlereagh |
0.2176 |
Lisburn and Castlereagh |
0.2722 |
25.09% |
|
Dungannon & South Tyrone |
0.2542 |
Mid Ulster |
0.3013 |
18.53% |
|
Strabane |
0.3808 |
Derry and Strabane |
0.4332 |
13.76% |
|
Magherafelt |
0.2693 |
Mid Ulster |
0.3013 |
11.88% |
|
Coleraine |
0.3206 |
Causeway Coast & Glens |
0.3568 |
11.29% |
|
Newry & Moume |
0.3303 |
Newry, Mourne and Down |
0.3528 |
6.81% |
|
Ards |
0.2796 |
North Down and Ards |
0.2986 |
6.80% |
|
Banbridge |
0.3769 |
Armagh, Banbridge and Craigavon |
0.4 |
6.13% |
|
Cookstown |
0.2879 |
Mid Ulster |
0.3013 |
4.65% |
|
Craigavon |
0.3907 |
Armagh, Banbridge and Craigavon |
0.4 |
2.38% |
|
North Down |
0.2923 |
North Down and Ards |
0.2986 |
2.16% |
|
Ballymena |
0.3877 |
Mid and East Antrim |
0.396 |
2.14% |
|
Newtownabbey |
0.3423 |
Antrim and Newtownabbey |
0.3492 |
2.02% |
|
Lisburn |
0.2669 |
Lisburn and Castlereagh |
0.2722 |
1.99% |
|
Ballymoney |
0.3516 |
Causeway Coast & Glens |
0.3568 |
1.48% |
|
Larne |
0.3904 |
Mid and East Antrim |
0.396 |
1.43% |
|
Derry |
0.4281 |
Derry and Strabane |
0.4332 |
1.19% |
|
Carrickfergus |
0.3933 |
Mid and East Antrim |
0.396 |
0.69% |
|
Down |
0.3513 |
Newry, Mourne and Down |
0.3528 |
0.43% |
|
Belfast |
0.3094 |
Belfast |
0.3094 |
0% |
|
Armagh |
0.4199 |
Armagh, Banbridge and Craigavon |
0.4 |
-4.74% |
|
Antrim |
0.3690 |
Antrim and Newtownabbey |
0.3492 |
-5.37% |
|
Moyle |
0.3902 |
Causeway Coast & Glens |
0.3568 |
-8.56% |
|
Limavady |
0.4124 |
Causeway Coast & Glens |
0.3568 |
-13.48% |
|
Omagh |
0.3752 |
Fermanagh and Omagh |
0.3238 |
-13.70% |
How much are you worth? Get a digital snapshot with Plans
More on Council Tax:
Council Tax rebanding: the risks
Comments
Be the first to comment
Do you want to comment on this article? You need to be signed in for this feature