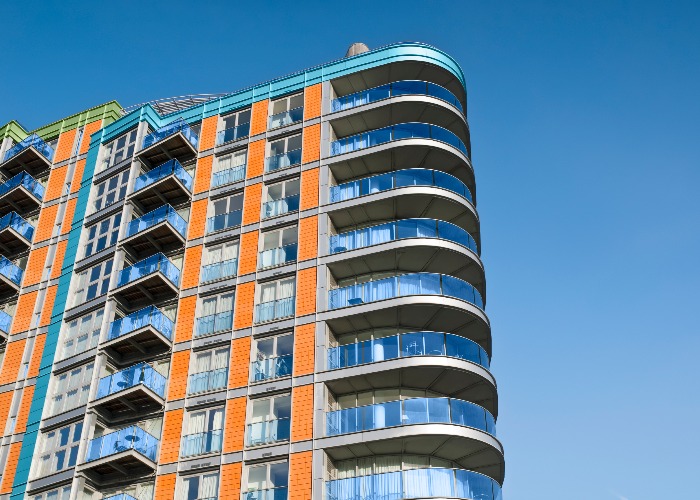
Average price of flat jumps £50,000 in 10 years

Flats have seen the most significant house price growth of any property type over the last decade.
The average price of a UK flat has rocketed by over £50,000 over the last decade.
That’s according to the latest research from Halifax, which found that the price had jumped from £157,172 in 2004 to £208,169 today. That equates to a price increase of £425 each month, or 32% over the decade.
The jump in prices for flats is more than double the 15% rise residential properties as a whole have experienced since 2004.
Trends by property type
Here’s a breakdown of how the various property types have seen prices change.
|
Property type |
Average price (Q2 2004) |
Average price (Q2 2014) |
Change |
|
Flat |
£157,172 |
£208,169 |
32% |
|
Terraced |
£149,067 |
£183,738 |
23% |
|
Semi-detached |
£166,968 |
£192,571 |
15% |
|
Bungalow |
£183,661 |
£208,115 |
13% |
|
Detached |
£283,449 |
£318,264 |
12% |
As you can see, each type of property has risen in price by more than 20%, though both flats and terraced properties have seen particularly strong growth. These figures are perhaps even more impressive when you consider that between 2007 and 2009, as a result of the financial crisis, each type of property fell in price by between 21% and 33%.
Halifax points to a “significant” increase in the number of first-time buyers since 2010 as one of the main reasons behind the increase in the value of flats and terraces.
In contrast, the lender suggests that homeowners who bought for the first time around the peak in the market are now struggling for equity. This makes taking the next step – to larger properties, like detached and semi-detached homes – that much more difficult, hence their relative underperformance.
Compare mortgages with lovemoney.com
How different regions have fared
Looking at the different types of property on a national basis doesn’t tell the whole story though. Let’s take a look at how they have fared in the different regions of the UK.
|
Region |
Terraced |
Semi-detached |
Detached |
Bungalows |
Flats |
All properties |
|
North |
8% |
1% |
10% |
11% |
8% |
5% |
|
North West |
13% |
6% |
3% |
2% |
0% |
5% |
|
Yorkshire & the Humber |
17% |
8% |
4% |
6% |
-14% |
5% |
|
West Midlands |
15% |
9% |
6% |
1% |
-7% |
5% |
|
East Midlands |
12% |
9% |
7% |
6% |
-19% |
4% |
|
East Anglia |
27% |
12% |
20% |
10% |
16% |
12% |
|
Greater London |
36% |
34% |
12% |
42% |
36% |
30% |
|
South East |
21% |
23% |
20% |
24% |
17% |
11% |
|
South West |
12% |
15% |
15% |
7% |
6% |
7% |
|
Wales |
15% |
4% |
4% |
10% |
22% |
4% |
|
Scotland |
28% |
30% |
23% |
36% |
43% |
30% |
As you can see, while flats have seen huge price growth in London, Scotland and Wales, they have actually fallen in price in three regions. Indeed, all types of property have seen only modest growth outside of London, the South East and Scotland.
Compare mortgages with lovemoney.com
More on property:
Take advantage of the mortgage price war
Comments
Be the first to comment
Do you want to comment on this article? You need to be signed in for this feature