The UK’s car accident hotspots

New figures reveal which areas have drivers who are most likely to have been involved in an accident.
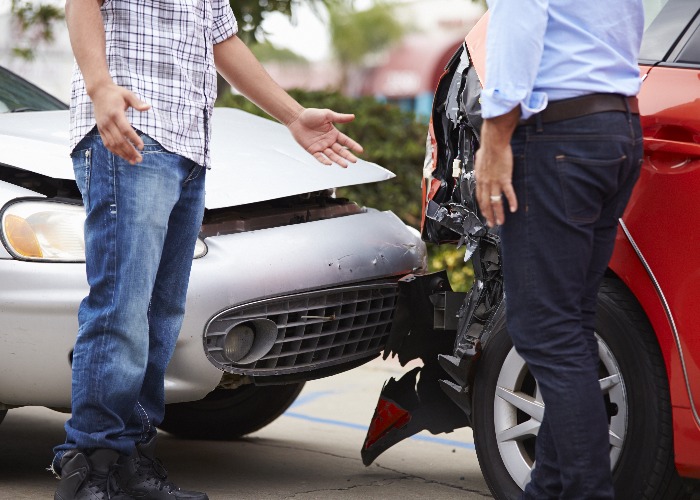
Getting caught up in a car accident is an incredibly stressful experience. First and foremost, there’s the risk of injury.
Even a fairly innocuous-looking shunt can lead to the requirement for lengthy treatment for things like whiplash.
Then of course there’s the financial side. The cars involved will need to be repaired, and you’ll either need to turn to your savings or make a claim on your car insurance.
Making that claim of course will then impact the cost of your insurance in the years to come, even if the accident wasn’t actually your fault.
But there can be significant regional differences when it comes to which areas drivers are most likely to be involved in an accident.
And now new figures have cast a light on which parts of the UK have the best drivers, the ones who don’t get involved in accidents, and which areas have drivers for whom a shunt is an all too regular occurrence.
Save up to £217 on your next insurance policy with MoneySuperMarket
The areas with the best drivers
Price comparison giant MoneySuperMarket has published data breaking down which towns boast the best drivers, and which are lumbered with the worst.
The research digs into a whopping 21 million car insurance enquiries run through the site, to pick out which areas are most likely to have drivers who have made a claim for an accident.
This is calculated on a percentage basis, to make comparisons between rival areas a little fairer.
So without any further ado, let’s take a look at the areas boasting the best drivers.
|
Area |
Total enquiries |
Enquiries with a main driver accident claim |
% of enquiries with a main driver accident claim |
|
IV - Inverness |
64,418 |
6,573 |
10.20% |
|
DG - Dumfries and Galloway |
42,453 |
4,857 |
11.44% |
|
PH - Perth |
44,020 |
5,058 |
11.49% |
|
SY - Shrewsbury |
96,021 |
11,307 |
11.78% |
|
BT - Belfast |
350,074 |
41,978 |
11.99% |
|
LL – Llandudno |
156,338 |
19,108 |
12.22% |
|
EX - Exeter |
145,469 |
18,329 |
12.60% |
|
TR – Truro |
87,353 |
11,096 |
12.70% |
|
AB – Aberdeen |
153,488 |
19,510 |
12.71% |
|
NW – North West London |
189,655 |
24,148 |
12.73% |
It seems we all have a lot to learn from Scottish drivers, given the top three spots ‒ and four of the top 10 ‒ are Scottish areas.
It’s important to note that these aren’t all just small regional towns either ‒ the sheer number of enquiries from large areas like Belfast, Aberdeen and NW London show that even if you live in a populous area, you aren’t necessarily more likely to have an accident claim on your record.
Save up to £217 on your next insurance policy with MoneySuperMarket
Where do you find the worst drivers?
What about the other end of the scale, where drivers are most likely to have a recent accident claim?
According to MoneySuperMarket, these are the 10 areas with the worst drivers.
|
Area |
Total enquiries |
Enquiries with a main driver accident claim |
% of enquiries with a main driver accident claim |
|
SM - Sutton |
72,728 |
13,767 |
18.93% |
|
HP - Hemel Hempstead |
173,915 |
32,777 |
18.85% |
|
WD - Watford |
103,109 |
18,920 |
18.35% |
|
SL - Slough |
168,875 |
30,780 |
18.23% |
|
B - Birmingham |
993,649 |
180,326 |
18.15% |
|
HD - Huddersfield |
115,261 |
20,779 |
18.03% |
|
HX - Halifax |
73,788 |
13,302 |
18.03% |
|
KT - Kingston-upon-Thames |
149,522 |
26,929 |
18.01% |
|
EN - Enfield |
151,013 |
27,190 |
18.01% |
|
CM - Chelmsford |
220,789 |
39,509 |
17.89% |
It’s difficult to overlook the fact that there are an awful lot of southern areas on this table. Clearly, something happens to drivers once they get lower than the Watford Gap.
Again, looking at the total enquiries for each region, there’s a massive range too from less than 73,000 in Sutton to almost one million motorists in Birmingham.
MoneySuperMarket also highlighted the age differences in those likely to have been in an accident.
Older drivers were found to be least likely, with just 15.03% of those aged 65 or over having endured an accident.
By contrast, it’s young drivers, aged 20 to 24, who were most likely to have a main driver accident claim.
Save up to £217 on your next insurance policy with MoneySuperMarket
Reducing your costs
Of course, your postcode is only one factor that goes into calculating your car insurance premium. There are all sorts of other considerations too, from the car itself to your job.
Thankfully that means there are plenty of opportunities for you to act and reduce the cost of your cover. Check out our comprehensive run through of the various things you can do to reduce your car insurance costs.
*This article contains affiliate links, which means we may receive a commission on any sales of products or services we write about. This article was written completely independently.
Comments
Be the first to comment
Do you want to comment on this article? You need to be signed in for this feature