Why energy bills have trebled in eight years
Cliff D'Arcy investigates why your energy bill has risen so much faster than the wholesale costs of gas and electricity.
After switching off my home heating during March's heat wave, I then had to switch it straight back on again, thanks to a cold snap during and after Easter.
These days, my gas and electricity bills total around £1,500 a year, which works out at around £125 a month. This is a huge increase since 2004, when I remember paying around £50 a month to heat and power my (then smaller) home.
Why have the UK's domestic energy bills gone up so much in recent years? Is it profiteering by the energy companies, or it is simply the rising wholesale cost of producing power? The answer, it seems, is a bit of both.
1. Oil gushes upwards
Although the oil price has been rising for many years, it has done so in fits and starts, notably with a huge rise and fall during 2007 and 2008.
Ten years ago, a barrel of Brent Crude traded at around $25. By July 2006, it had tripled to $75, before falling back to $55 at the start of 2007. The oil price then exploded, soaring to a high of $147 in July 2008, before crashing back to $40 at the end of 2008. Since then, the price of oil has tripled, with a barrel of Brent now priced at almost $120.
In short, the oil price has more than quadrupled in the past decade and, inevitably, this extra cost has ended up being paid by consumers and businesses.
2. Gas goes bang
What's more, the wholesale price of gas has risen strongly in recent years. In fact, the wholesale price of gas has risen by three-quarters (75%) over the past seven years.
However, according to our energy partner energyhelpline, domestic gas prices have risen much more steeply. For example, the price per kilowatt-hour (kWh) of the British Gas Standard Quarterly Billing tariff has more than doubled, having risen 108% in the past seven years.
What's more, take a look at this graph, which shows how the typical cost of domestic gas has exploded since 2002:
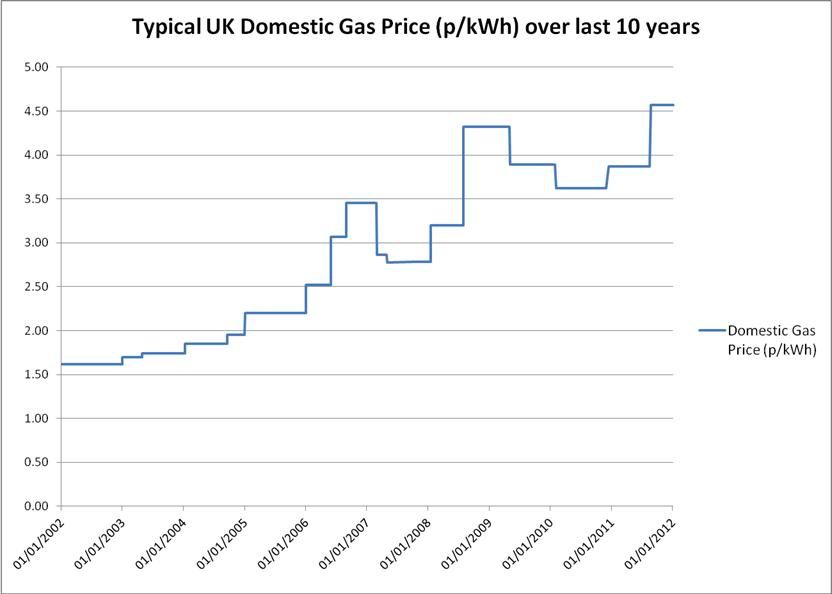
Source: energyhelpline
As you can see, despite drops in 2007 and 2009/10, the domestic price of gas has been rising steadily for most of the past decade. Indeed, the price today is close to its all-time high, with gas costing nearly three times as much as it did in 2002.
In short, domestic gas prices have risen much faster than wholesale prices, which suggests that British households are being ripped off when heating and eating.
3. An electric shock
In the past three years, the wholesale cost of electricity is up a modest 5%. Furthermore, it has tumbled about a fifth (20%) since peaking in November 2008.
Yet electricity prices have risen strongly over the past few years, as you can see from the following table. Some of them have even changed their prices on three separate occasions in that time:
Electricity price changes since 2010, by supplier
|
Supplier |
Effective date |
Change |
Effective date |
Change |
Effective date |
Change |
|
Atlantic |
14/09/11 |
11.0% |
- |
- |
- |
- |
|
British (Scottish) Gas |
12/01/12 |
-5.0% |
18/08/11 |
16.0% |
10/12/10 |
7.0% |
|
E.ON |
27/02/12 |
-6.0% |
13/09/11 |
11.5% |
04/02/11 |
9.0% |
|
Ebico |
14/09/11 |
12.2% |
- |
- |
- |
- |
|
EDF Energy |
10/11/11 |
4.5% |
02/03/11 |
7.5% |
- |
- |
|
first:utility |
01/12/11 |
9.5% |
01/04/11 |
27.9% |
23/02/10 |
11.0% |
|
Green Energy UK |
01/11/11 |
6.3% |
01/05/11 |
3.9% |
- |
- |
|
LoCO2 Energy |
01/10/11 |
5.0% |
01/01/11 |
5.9% |
01/11/10 |
3.0% |
|
London Energy |
10/11/11 |
4.5% |
02/03/11 |
7.5% |
- |
- |
|
npower |
01/10/11 |
7.2% |
04/01/11 |
4.9% |
- |
- |
|
Ovo Energy |
10/01/11 |
7.5% |
28/04/10 |
5.2% |
25/03/10 |
-5.4% |
|
Scottish Hydro |
14/09/11 |
11.0% |
- |
- |
- |
- |
|
Scottish Power |
01/08/11 |
10.0% |
25/11/10 |
8.9% |
- |
- |
|
Seeboard |
10/11/11 |
4.5% |
02/03/11 |
7.5% |
- |
- |
|
Southern Electric |
14/09/11 |
11.0% |
- |
- |
- |
- |
|
SWALEC |
14/09/11 |
11.0% |
- |
- |
- |
- |
|
SWEB |
10/11/11 |
4.5% |
02/03/11 |
7.5% |
- |
- |
|
Utilita |
01/09/11 |
0.8% |
- |
- |
- |
- |
|
Utility Warehouse |
16/09/11 |
9.4% |
01/04/11 |
0.7% |
- |
- |
Source: energyhelpline
After several rounds of price rises in 2010 and 2011, a few electricity providers cut their prices earlier this year -- notably 'Big Six' suppliers British Gas (down 5% in January) and E.ON (down 6% in February).
Even so, the general trend has been strongly upwards, with some suppliers raising electricity prices by between 25% and 28% in a single round of rises.
4. No ratchet effect?
A ratchet is a gear that can rotate in one direction, but not the reverse. Thus, a ratchet can turn only one way. When looking at the domestic energy market, it may appear as if some sort of ratchet is at work, as prices always seem to be rising, but rarely fall back.
However, energy regulator Ofgem has investigated this market several times and found no evidence of any ratchet effect and/or collusion between suppliers. This table details the last movements in gas prices:
|
Supplier |
Effective date |
Gas |
|
Atlantic |
26/03/12 |
-3.8% |
|
British (Scottish) Gas |
18/8/11 |
18% |
|
E.ON |
13/09/11 |
18% |
|
Ebico |
26/03/12 |
-4.5% |
|
EDF Energy |
07/02/12 |
-5.0% |
|
first:utility |
01/12/11 |
9.5% |
|
Good Energy |
06/09/11 |
9.4% |
|
London Energy |
07/02/12 |
-5.0% |
|
npower |
01/02/12 |
-5.0% |
|
Ovo Energy |
10/01/11 |
6.3% |
|
Scottish Hydro |
26/03/12 |
-3.8% |
|
Scottish Power |
27/02/12 |
-5.0% |
|
Seeboard |
07/02/12 |
-5.0% |
|
Southern Electric |
26/03/12 |
-3.8% |
|
Spark Energy |
01/07/09 |
-10.7% |
|
SWALEC |
26/03/12 |
-3.8% |
|
SWEB |
07/02/12 |
-5.0% |
|
Utilita |
01/09/11 |
12.6% |
|
Utility Warehouse |
01/03/12 |
-3.9% |
Source: energyhelpline
While a few suppliers have raised their rates in 2011/12, most of the bigger players have opted to reduce their gas tariffs. These include EDF Energy, London Energy, npower, Scottish Power and Seeboard, all down 5.0% -- which looks like 'suspicious clustering' to me.
Large increases in the cost of crude oil and natural gas have had a big impact on Britain's domestic energy bills over the last ten years. Nevertheless, with domestic price rises far outstripping wholesale increases, it certainly looks like the power companies are fleecing us!
More on gas and electricity bills:
Compare tariffs with lovemoney.com
Energy companies to tell customers about best tariffs
How to get free cavity wall and loft insulation
EDF announces price promise and help for vulnerable
You’re subsidising your neighbour’s energy bills!
Comments
Be the first to comment
Do you want to comment on this article? You need to be signed in for this feature